Census geography: Bridging data from prior years to the 2010 tract boundaries>>
Boundary adjustments with national U.S. census tract
The LTDB uses areal interpolation to estimate population characteristics from prior years within 2010 boundaries. Depending on what information is available at a very local scale, the interpolation is based on a combination of area and population weighting (2000) or only on area weighting (1970-1990). The former approach is the current standard in the field, but where appropriate small unit population data are not available, areal interpolation is the fallback option. Following is a brief description of the method used for the LTDB. For a more complete discussion see Logan, Xu, and Stults (2014), "Interpolating US Decennial Census Tract Data from as Early as 1970 to 2010: A Longitudinal Tract Database" (Click here to download).
Combining areal and population interpolation
Bridging between 2000 and 2010 in the LTDB is greatly facilitated by the Topological Faces layer of the TIGER/Line shapefiles created by the Census Bureau, which shows the intersection between blocks and tracts (and many other geographic layers) as defined in the 2000 and 2010 censuses. This file is available to be downloaded. The face polygons created by the intersection of these multiple geographic boundaries are in effect the smallest possible sub-block unit in census geography; which we term a fragment. Each one is uniquely identified by a topological face ID (TFID), and it includes several useful attributes: total area, an indicator of whether the face polygon is water or land, and all geocodes (from block ID to state FIPS code) in both the 2000 and 2010 census. We reduce the Faces file to the tract and block layers for 2000 and 2010, and we work with the fragments from the intersection of these layers.
The next step is to allocate reported tract level population characteristics from 2000 (such as counts by race and age) to blocks within the tract. The LTDB bases this allocation on the blocks share of the total tract population in 2000. It then estimates what share of the 2000 block population and of every population subgroup (estimated in the previous step) lies in each fragment within that block. It does this through simple areal interpolation based on the fragments share of the block area. This estimate is refined with ancillary data provided in the Faces file that identifies water fragments with no population that should be disregarded.
It is straightforward to aggregate fragments to the 2010 census tracts. The assumption that all population characteristics have the same distribution as the total population across blocks within a tract, and across fragments within a block, is the main source of error in the estimate.
NCDB used ancillary data from the streets coverage from Tiger/Line 1992 to bridge 1990 data to 2000 tract boundaries. Every 1990 block was linked to census tracts in 2000. When the block was fully within the boundaries of the 2000 tract, its 1990 population was used as the population weight. When the block was located in more than one 2000 tract, the length of streets within each fragment was used to determine what share of the block population to allocate to each tract. The assumption is that population is highly correlated with the extent of local roads, though it was not known whether there were homes on these roads. To the extent that roads indicate population, this procedure is superior to weighting block fragments by their area. NCDB created a 1990-2000 proprietary Block Weighting File (BWF) to represent what share of a given 1990 blocks population should be estimated to fall within each 2000 tract. As in the LTDB these same weights were used to estimate all census variables.
Interpolation with area weights
Areal interpolation requires only that we have an accurate overlay of the tract boundaries in two years. The LTDB estimates for 1970-1990 are based on tract boundaries from the National Historic Geographic Information System (NHGIS). With these we created a tract-level equivalent of a Topological Faces relationship table for 1970-2000. The first step is to overlay the 2000 tract boundary file onto the 1990 boundary file and merge these into a single layer. For each tract that did not change between 1990 and 2000, the result is a single polygon and data record. For tracts that changed, multiple records exist in the new layer. We then merge 1990 census data with this new layer using 1990 state, county, and tract codes, and we apportion the 1990 counts to each fragment of the split tract using the area proportions as weights.
We repeat the same process for 1970 and 1980, again using the 2000 tract file as the overlay. We then use the population and area based interpolation method described previously to adjust the data from 2000 tract boundaries to 2010 tract boundaries.
NCDB used a similar approach for 1980, first linking source year tracts to 1990 blocks, and then interpolating from those blocks to 2000 tracts. NCDB used area-weighted interpolation using spatial data from Tiger/Line 1992. A less precise area weighting was used for 1970 that relied on the Census Bureaus tract correspondence file between 1970 and 1980. Every 1970 tract contributing to a 1980 tract was weighted equally. Then 1980 tracts were linked to 1990 blocks, and in a final step to 2000 tracts.
Researchers should be aware of the potential for error in interpolation that is based only on area weights. The figure below presents an extreme example of what can happen. Here a single tract in 2000 was split into three tracts in 2010. The block populations in 2000 show that the very large area that became tract 36045980000 was almost unpopulated. The LTDB population estimate for this tract based on area+population weighting is only 11. Yet areal interpolation alone suggests that most population in the source tract should be estimated to be in 36045980000. Note also that some populous blocks in 2000 have been divided in 2010 between two tracts. An area+population weighting would yield reasonable estimates if population within each of these is not greatly skewed to one portion of its area.
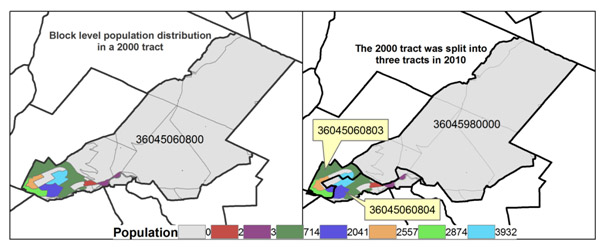
Example of a split tract in 2000-2010, showing the block populations (color-coded) in 2000 in each panel. On the left are the 2000 tract boundaries; on the right are 2010 boundaries.
We have made a series of comparisons for 2000-2010 (comparing our combined area and population interpolation with an alternative in which we only take into account area) in order to illustrate how these approaches can lead to different results. These comparisons involve a selection of variables. Some of these are population counts: total population, non-Hispanic white population, Asian population, college graduates, and home owners. Others are rates or medians: population density, percent non-Hispanic white, percent Asian, percent college graduates, percent home owners, and median household income. It is more difficult to estimate absolute numbers (because these depend on how fully the area of a census tract has been settled) than to estimate compositional characteristics such as percentages and rates (which tend to be similar across adjacent tracts).
We found that split tracts yield more disparate estimates than do tracts with many-to-many changes. In addition the estimates of absolute numbers (counts) have much greater discrepancies than the estimates of rates or averages. As an example, consider the estimates of non-Hispanic white residents and non-Hispanic white percentage for split tracts. The correlations for the number of whites are .427 and .681, and less than 20% of cases have discrepancies of less than 0.1 standard deviation. But estimates of the white percentage have near-perfect correlations. And close to 100% of estimates are within 0.1 standard deviation of each other.
As expected, when all tracts are included in the comparison, the correlations are higher and discrepancies are smaller. For example the two estimates of total population are correlated at .88, white count at .93, and Asian count at .97. Hence the potential errors resulting from reliance on area-weighted interpolation are moderated by the many tracts that require no estimation.